The gold standard for SARS-CoV-2 diagnosis is the Reverse Transcriptase Polymerase Chain Reaction, aka RT-PCR or qRT-PCR.
This technique has been introduced in 1983 (Saiki et al. 1985) and nowadays is widely used in the diagnosis of many pathologies, from infectious diseases to metabolic, oncologic, and degenerative (Valones et al. 2009).
RT-PCR has been indicated as the first choice in the diagnosis of SARS-CoV-2 and it is used with a standard protocol suggested by American CDC (https://www.fda.gov/media/134922/download).
Extraction
This technique begins after RNA is extracted from infected (or presumed infected subjects) cells by the use of a dedicated swab (Corman et al. 2020).
Amplification
RT-PCR copies many and many times the viral genome, if present, allowing to obtain a relative quantification of the viral load.
The copy phase, called amplification, is needed to make viral sequence quantifiable thanks to specific adapters (or primers), synthesized ad hoc, able to recognize just the viral genes directed to (Zou et al. 2020). The specificity of the target genes makes it possible to discriminate the presence of SARS CoV-2 virus from all the others, even if it belongs to the same Corona family: the absence of those genes does not allow the copy machinery which, overall, restarts 45 times (cycles) (Corman et al. 2020). Each cycle is characterized by several steps: recognizing phase (denaturation and annealing) of the primers to the target, copy (elongation) of the target sequence, and gene detection.
The amplicon is detected through a specific fluorescence probe: each probe, specific for each target amplified, is associated with a unique fluorophore.
Positive and negative controls
Positive and negative controls are performed at the same time on the unknown samples: it is the comparison between the results on the unknown and the controls that defines the good quality of the tests.
Moreover, the controls are needed to set the threshold up.
The threshold line must be settled just immediately upper the amplification line of the backgrounds of controls. The threshold must intersect the exponential phase of individual amplification plots In the cases when the Ct values are very high and the ΔRn values are very low, the exponential phase of the amplification plot will not be well defined, so it will be necessary to make threshold adjustments that generate a (qualitative) positive sample (Bustin and Nolan 2004).
What could go wrong: pitfalls in the pre-analytical and analytical phase
As diagnosis with RT-PCR is a multistage process, it’s likely to encounter errors that affect the result.
Two main stages can be identified: pre-analytical phase (reagents chose, sample collection, conservation, RNA extraction, and its conservation) and analytical phase (RT-PCR).
Pre-analytical phase pitfalls
Most pre-analytical errors are often associated with the use of:
- expired or not updated kits (gene drop-out events). FDA has warned many laboratories about the use of some SARS-CoV-2 PCR tests which have reduced their sensitivity due to mutations in the target sequences (gene drop-out) with an increased false-negative rate (https://www.fda.gov/medical-devices/coronavirus-covid-19-and-medical-devices/sars-cov-2-viral-mutations-impact-covid-19-tests). These kits are:
- Accula SARS-CoV-2 Test (Mesa Biotech Inc.)
- Linea COVID-19 Assay Kit (Applied DNA Sciences, Inc.)
- TaqPath COVID-19 Combo Kit (Thermo Fisher Scientific, Inc.)
- Xpert Xpress SARS-CoV-2, Xpert Xpress SARS-CoV-2 DoD, Xpert Omni SARS-CoV-2 (Cepheid)
- collection liquids without preservatives or with expired ones (Houseley and Tollervey 2009).
- storing samples (or RNA) at room temperature (Mathay et al. 2012).
Analytical (or amplification) phase pitfalls
Several pitfalls are encountered while carrying out the analytical or amplification phase. Here are the most commons:
- Abnormal curves profiles. Sometimes, when PCR has finished and we look at the monitor graph, a bad curve profile makes us unhappy and lets us understand that we must repeat the run. In most of these cases, curves appear linear or zigzagged (figure 1a), very distant from the expected sigmoid profile.
Other times the maximum RFU is lower than expected (Figure 1b).
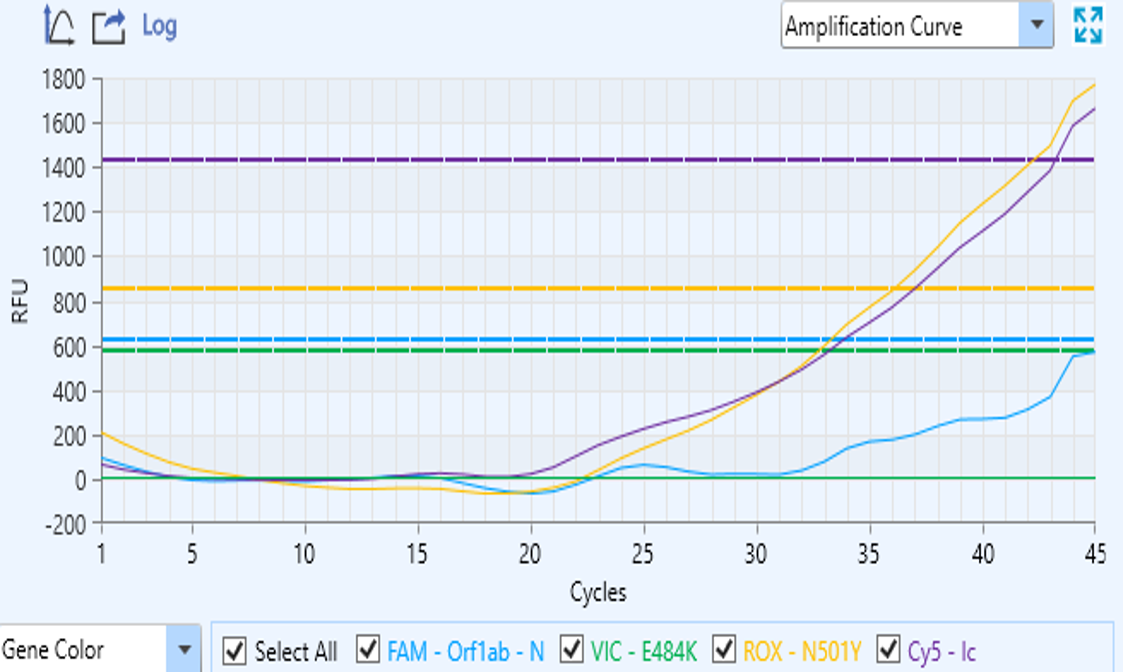
Figure 1a – Linear or zigzagged curve
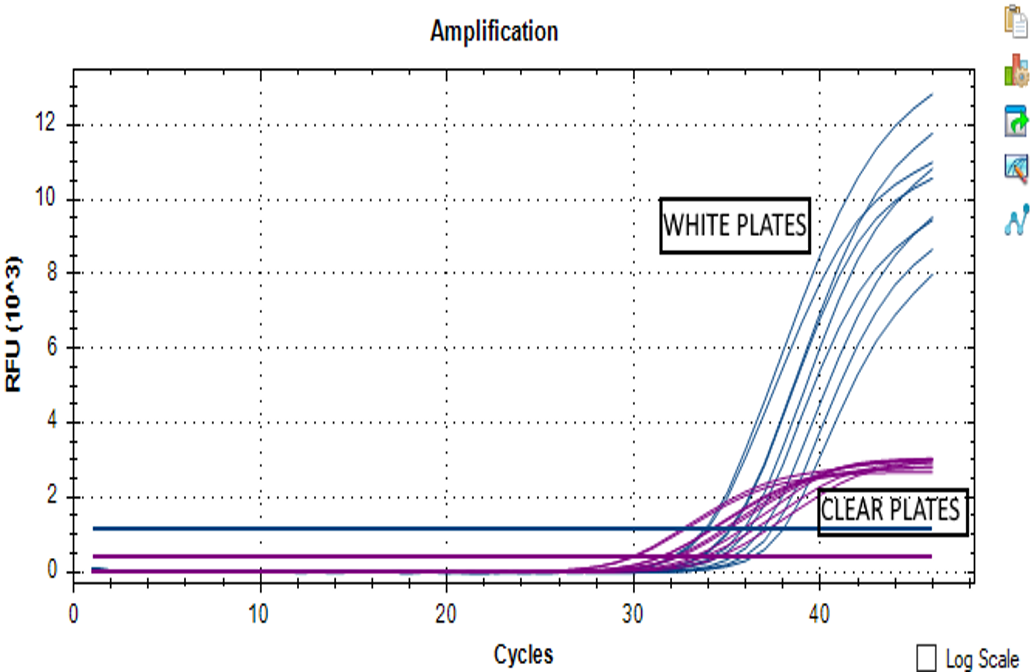
Figure 1b – Low RFU
When these curve profiles are found in almost all the wells, then, the cause is given by the plate. When using the fluorophores-based PCR kits it is necessary to use white plates (shielded). Using not clear plates as the white ones improves the sensitivity and consistency by avoiding fluorescence refraction out of the plates.
- Bad amplification of the IC. Sometimes an apparent inconsistent curve could appear in the IC profile (Figure 2a) while specific gene amplification is obtained. In this case, most of the manufacturers suggest repeating the test.
In a deeper analysis, looking at the graphs in the log scale view (Figure 2b) helps to interpret the results.If the curves reach and overcome the threshold line, the sample is positive.
Set the analysis using log scale view is always suggested.
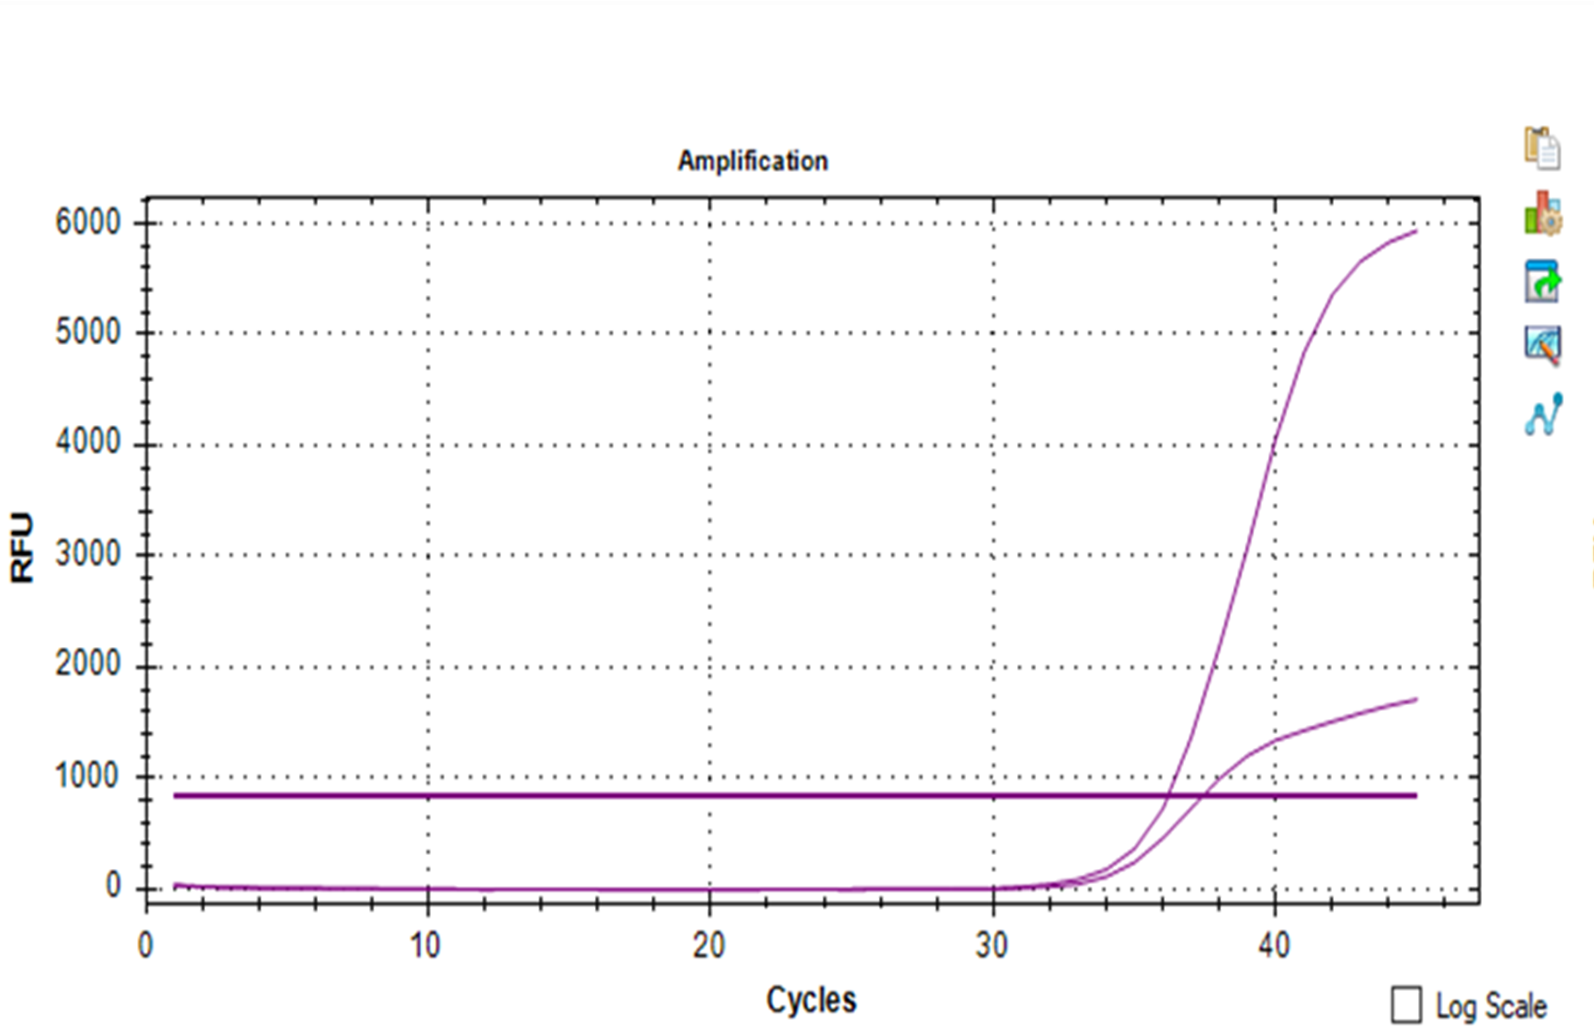
Figure 2a – Inconsistent curve in the IC profile
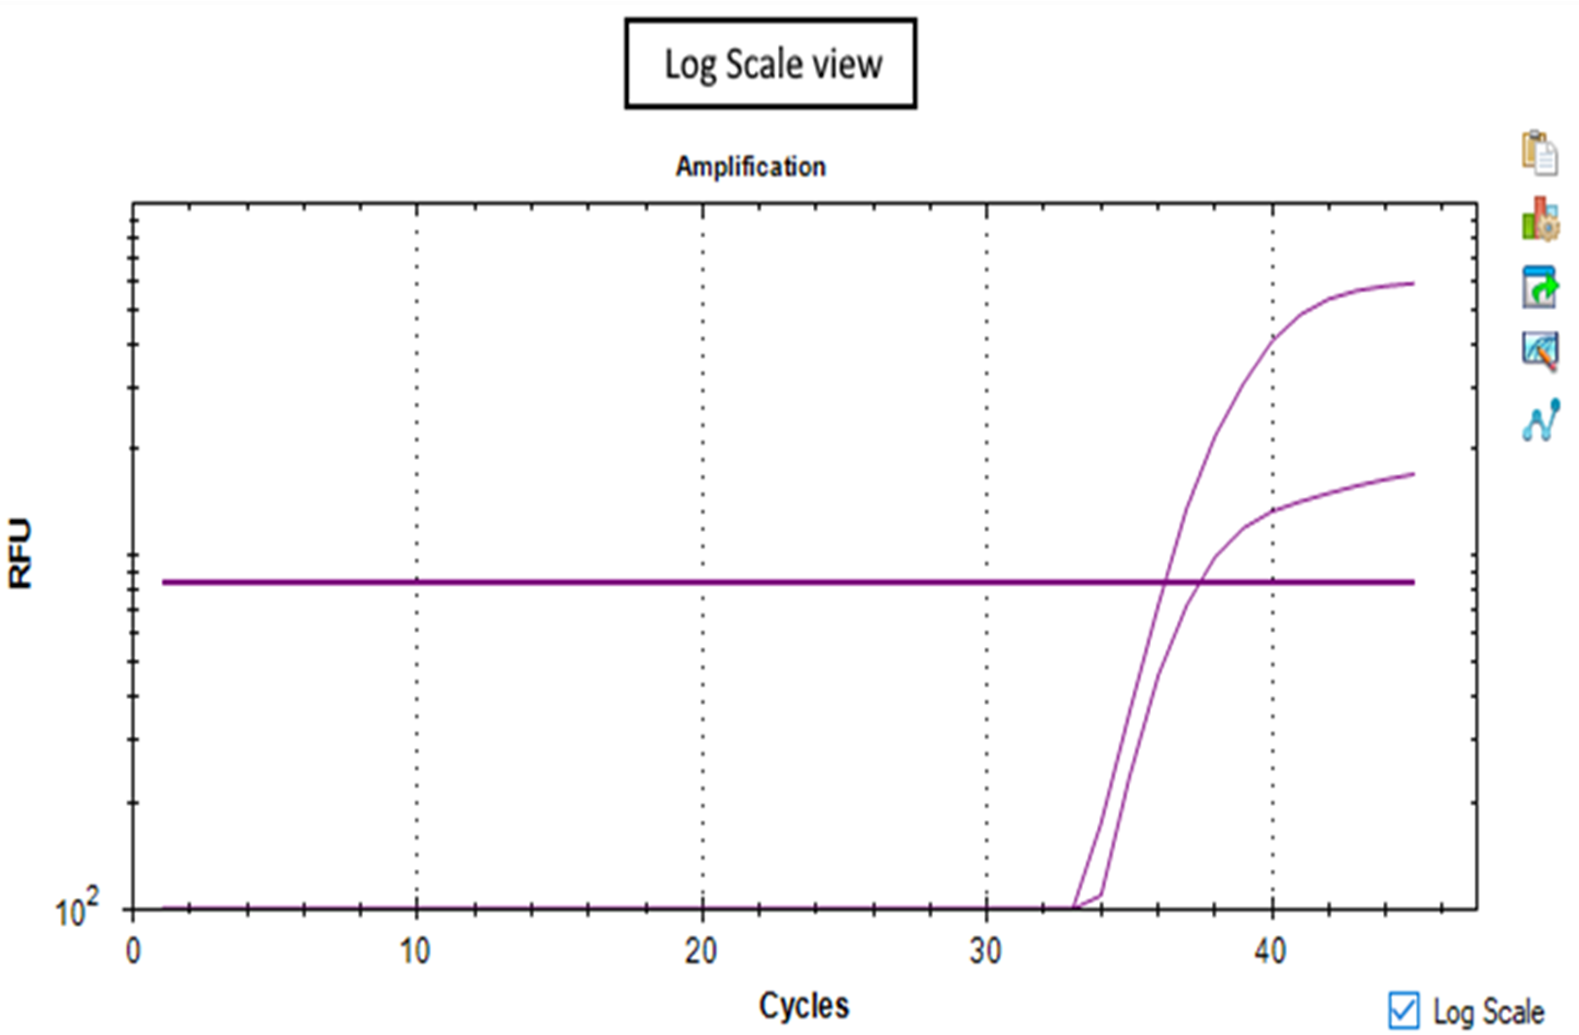
Figure 2b -Log scale view
- Absence of amplifications. In general, the absence of amplifications (no specific genes nor IC curves) could occur for three reasons: RNA degradation, ineffective extraction, presence of bubbles in the reaction well.
- RNA degradation is due usually when the sample is not processed immediately after the RNA is extracted. In this case, is important to add preservatives reagents in the suspension buffer used to resuspend RNA after extraction and immediately store RNA at -80. It is suggested to store swabbed materials rather than RNA. RNA is very unstable and sensitives to pH, temperature, and light.
- Ineffective extraction. Many amplification kits are associated with their own extraction kit. If two different brands are used (one for extraction and one for amplification) it is suggested to increase the washing and sample enrichment cycles to eliminate traces of contaminants (or salts) present in the extraction buffers. The presence of salts can make both the reverse transcription and amplification mechanisms inefficient, as well as alters the binding affinity of the primers to the target sequences.
- Bubbles in the reaction well. Pipetting several reagents can easily form bubbles in well. Bubbles play a very bad role during PCR performances and are among the most frequent cause of invalid tests. Their presence could be avoided with careful management of reagents, kits and plates or tubes (especially after filling). A fundamental also basic role is to spin plates or tubes (at maximum speed for almost 30 seconds) before starting RT-PCR reaction.
Written by Simone Di Giacomo, PhD, OaCP R&D Manager
Our support team has reviewed every issue worked with our clients, and we have decided to share our experience with you.
We will publish a complete and detailed guide of the whole RT-PCR process, including tips and tricks to avoid the most common pitfalls.
Bibliography:
Bustin, Stephen A., and Tania Nolan. 2004. “Pitfalls of Quantitative Real- Time Reverse-Transcription Polymerase Chain Reaction.” Journal of Biomolecular Techniques.
Corman, Victor M. et al. 2020. “Detection of 2019 Novel Coronavirus (2019-NCoV) by Real-Time RT-PCR.” Eurosurveillance.
Houseley, Jonathan, and David Tollervey. 2009. “The Many Pathways of RNA Degradation.” Cell.
Mathay, Conny et al. 2012. “Short-Term Stability Study of RNA at Room Temperature.” Biopreservation and Biobanking.
Saiki, Randall K. et al. 1985. “Enzymatic Amplification of β-Globin Genomic Sequences and Restriction Site Analysis for Diagnosis of Sickle Cell Anemia.” Science.
Valones, Marcela Agne Alves et al. 2009. “Principles and Applications of Polymerase Chain Reaction in Medical Diagnostic Fields: A Review.” Brazilian Journal of Microbiology.
Zou, Lirong et al. 2020. “SARS-CoV-2 Viral Load in Upper Respiratory Specimens of Infected Patients.” New England Journal of Medicine.
